Amazon Managed Service for Prometheusが値下げされるという 記事 を見かけて、「そろそろMicrometerのモニタリングシステムをCloud Watchから乗り換えるか」って気持ちになったのでPrometheusをサクッと試してみました。
Prometheusとは
Prometheusは、SoundCloudが2012年に作ったOSSのシステムモニタリングとアラートのツールです。
機能
- メトリクス名とkey/valueペアによって識別された時系列データを持つ多次元のデータモデル
- この次元を利用するための柔軟性のあるクエリ言語のPromQLを提供
- 依存しない分散型ストレージ。シングルサーバノードが独立している
- メトリクスの収集方法はプル型
- 中間ゲートウェイ経由でプッシュ型もサポートしている
- サービスディスカバリや静的な設定経由で、ターゲットが検出される
- グラフ化やダッシュボード化のいくつかのモードをサポートしている
コンポーネント
Prometheusのエコシステムは複数のコンポーネントから成り立つ
- メインのPrometheusサーバは時系列データを取得して保存する
- 計測するアプリケーションコードのためのクライアントライブラリ
- 一時的なジョブをサポートするためのプッシュゲートウェイ
- HAProxy, StatsD, Graphite, などのようなサービスのための特別な目的のエクスポーターズ
- アラートを扱うためのアラートマネージャ
- 多くのPrometheusコンポーネントはgolangで書かれている
Micrometerとは
以前書いた Micrometerでメトリクスを収集してAmazon Cloud Watchで可視化する にまとめてあるので省略。
アプリケーション作成
メトリクス収集対象のアプリケーションを作ります。今回はSpring Bootで作ります。
まず、build.gradleの依存関係です。PrometheusがActuatorのエンドポイントを叩いてメトリクス情報を収集します。
dependencies {
  implementation 'org.springframework.boot:spring-boot-starter-actuator'
  implementation 'org.springframework.boot:spring-boot-starter-web'
  runtimeOnly 'io.micrometer:micrometer-registry-prometheus'
}
次に、アプリケーションの実装です。
@RestController
@RequestMapping("/")
public class IndexController {
  @GetMapping
  public IndexResponse index() {
    return new IndexResponse("Hello World!!");
  }
}
アプリケーションを起動して、GET http://localhost:8080を叩くと次のようなレスポンスが返ってきます。
{
  "message": "Hello World!!"
}
次に、Actuatorの GET /actuator/prometheus エンドポイントを有効にします。Prometheusがこのエンドポイントを叩いてメトリクス情報を収集します。
management:
  endpoints:
    web:
      exposure:
        include: prometheus
GET http://localhost/actuator/prometheusを叩くと、Prometheusのフォーマットでメトリクス情報が返ってきます。
Dockerコンテナで起動
docker-compose.ymlを用意して、先に実装したアプリケーションとPrometheusをDockerコンテナ上で起動するようにします。
version: '3'
services:
  prometheus:
    image: prom/prometheus
    container_name: prometheus
    volumes:
      - ./prometheus:/etc/prometheus
    command: "--config.file=/etc/prometheus/prometheus.yml"
    ports:
      - 9090:9090
    restart: always
  micrometer-prometheus-api:
    image: micrometer-prometheus-api
    container_name: micrometer-prometheus-api
    ports:
      - 18080:8080
次に、Prometheusの設定ファイルを用意します。 ほぼ、Spring Bootのドキュメントにあるサンプル通りです。
global:
  scrape_interval: 10s
  scrape_timeout: 10s
  evaluation_interval: 10s

scrape_configs:
  - job_name: 'micrometer-prometheus'
    metrics_path: '/actuator/prometheus'
    static_configs:
      - targets:
        - micrometer-prometheus-api:8080
次に、jibのGradleプラグインを使ってアプリケーションのDockerイメージを作成します。8080番ポートで起動するようにしています。
plugins {
  id 'com.google.cloud.tools.jib' version '3.0.0'
}

jib {
  container {
      ports ['8080']
      jvmFlags = ['--enable-preview']
  }
  from {
      image = 'openjdk:15-alpine'
  }
  to {
      image = 'micrometer-prometheus-api'
      tags = ['latest']
  }
}
./gradlew jibDockerBuildでDockerイメージを作成します。
それでは、コンテナを起動してみましょう。
$ docker-compose up
prometheus                   | level=info ts=2021-05-14T04:11:02.765Z caller=main.go:388 msg="No time or size retention was set so using the default time retention" duration=15d
prometheus                   | level=info ts=2021-05-14T04:11:02.765Z caller=main.go:426 msg="Starting Prometheus" version="(version=2.27.0, branch=HEAD, revision=24c9b61221f7006e87cd62b9fe2901d43e19ed53)"
prometheus                   | level=info ts=2021-05-14T04:11:02.765Z caller=main.go:431 build_context="(go=go1.16.4, user=root@f27daa3b3fec, date=20210512-18:04:51)"
prometheus                   | level=info ts=2021-05-14T04:11:02.765Z caller=main.go:432 host_details="(Linux 5.10.25-linuxkit #1 SMP Tue Mar 23 09:27:39 UTC 2021 x86_64 29b273b8d0c7 (none))"
prometheus                   | level=info ts=2021-05-14T04:11:02.765Z caller=main.go:433 fd_limits="(soft=1048576, hard=1048576)"
prometheus                   | level=info ts=2021-05-14T04:11:02.765Z caller=main.go:434 vm_limits="(soft=unlimited, hard=unlimited)"
prometheus                   | level=info ts=2021-05-14T04:11:02.778Z caller=web.go:540 component=web msg="Start listening for connections" address=0.0.0.0:9090
prometheus                   | level=info ts=2021-05-14T04:11:02.780Z caller=main.go:803 msg="Starting TSDB ..."
prometheus                   | level=info ts=2021-05-14T04:11:02.788Z caller=tls_config.go:191 component=web msg="TLS is disabled." http2=false
prometheus                   | level=info ts=2021-05-14T04:11:02.790Z caller=head.go:741 component=tsdb msg="Replaying on-disk memory mappable chunks if any"
prometheus                   | level=info ts=2021-05-14T04:11:02.794Z caller=head.go:755 component=tsdb msg="On-disk memory mappable chunks replay completed" duration=6.319µs
prometheus                   | level=info ts=2021-05-14T04:11:02.794Z caller=head.go:761 component=tsdb msg="Replaying WAL, this may take a while"
prometheus                   | level=info ts=2021-05-14T04:11:02.795Z caller=head.go:813 component=tsdb msg="WAL segment loaded" segment=0 maxSegment=0
prometheus                   | level=info ts=2021-05-14T04:11:02.795Z caller=head.go:818 component=tsdb msg="WAL replay completed" checkpoint_replay_duration=42.188µs wal_replay_duration=1.023386ms total_replay_duration=1.236444ms
prometheus                   | level=info ts=2021-05-14T04:11:02.799Z caller=main.go:828 fs_type=EXT4_SUPER_MAGIC
prometheus                   | level=info ts=2021-05-14T04:11:02.799Z caller=main.go:831 msg="TSDB started"
prometheus                   | level=info ts=2021-05-14T04:11:02.799Z caller=main.go:957 msg="Loading configuration file" filename=/etc/prometheus/prometheus.yml
prometheus                   | level=info ts=2021-05-14T04:11:02.805Z caller=main.go:988 msg="Completed loading of configuration file" filename=/etc/prometheus/prometheus.yml totalDuration=6.051413ms remote_storage=2.506µs web_handler=635ns query_engine=1.369µs scrape=2.644871ms scrape_sd=85.53µs notify=1.254µs notify_sd=2.059µs rules=1.15µs
prometheus                   | level=info ts=2021-05-14T04:11:02.805Z caller=main.go:775 msg="Server is ready to receive web requests."
micrometer-prometheus-api    |
micrometer-prometheus-api    |   .   ____          _            __ _ _
micrometer-prometheus-api    |  /\\ / ___'_ __ _ _(_)_ __  __ _ \ \ \ \
micrometer-prometheus-api    | ( ( )\___ | '_ | '_| | '_ \/ _` | \ \ \ \
micrometer-prometheus-api    |  \\/  ___)| |_)| | | | | || (_| |  ) ) ) )
micrometer-prometheus-api    |   '  |____| .__|_| |_|_| |_\__, | / / / /
micrometer-prometheus-api    |  =========|_|==============|___/=/_/_/_/
micrometer-prometheus-api    |  :: Spring Boot ::                (v2.4.5)
micrometer-prometheus-api    |
micrometer-prometheus-api    | 2021-05-14 05:25:22.680  INFO 1 --- [           main] c.b.micrometerprometheus.Application     : Starting Application using Java 15-ea on aad30f1b5aec with PID 1 (/app/classes started by root in /)
micrometer-prometheus-api    | 2021-05-14 05:25:22.684  INFO 1 --- [           main] c.b.micrometerprometheus.Application     : No active profile set, falling back to default profiles: default
micrometer-prometheus-api    | 2021-05-14 05:25:23.854  INFO 1 --- [           main] o.s.b.w.embedded.tomcat.TomcatWebServer  : Tomcat initialized with port(s): 8080 (http)
micrometer-prometheus-api    | 2021-05-14 05:25:23.866  INFO 1 --- [           main] o.apache.catalina.core.StandardService   : Starting service [Tomcat]
micrometer-prometheus-api    | 2021-05-14 05:25:23.867  INFO 1 --- [           main] org.apache.catalina.core.StandardEngine  : Starting Servlet engine: [Apache Tomcat/9.0.45]
micrometer-prometheus-api    | 2021-05-14 05:25:23.928  INFO 1 --- [           main] o.a.c.c.C.[Tomcat].[localhost].[/]       : Initializing Spring embedded WebApplicationContext
micrometer-prometheus-api    | 2021-05-14 05:25:23.929  INFO 1 --- [           main] w.s.c.ServletWebServerApplicationContext : Root WebApplicationContext: initialization completed in 1182 ms
micrometer-prometheus-api    | 2021-05-14 05:25:24.458  INFO 1 --- [           main] o.s.s.concurrent.ThreadPoolTaskExecutor  : Initializing ExecutorService 'applicationTaskExecutor'
micrometer-prometheus-api    | 2021-05-14 05:25:24.640  INFO 1 --- [           main] o.s.b.a.e.web.EndpointLinksResolver      : Exposing 1 endpoint(s) beneath base path '/actuator'
micrometer-prometheus-api    | 2021-05-14 05:25:24.688  INFO 1 --- [           main] o.s.b.w.embedded.tomcat.TomcatWebServer  : Tomcat started on port(s): 8080 (http) with context path ''
micrometer-prometheus-api    | 2021-05-14 05:25:24.705  INFO 1 --- [           main] c.b.micrometerprometheus.Application     : Started Application in 2.464 seconds (JVM running for 2.963)
micrometer-prometheus-api    | 2021-05-14 05:25:26.655  INFO 1 --- [nio-8080-exec-1] o.a.c.c.C.[Tomcat].[localhost].[/]       : Initializing Spring DispatcherServlet 'dispatcherServlet'
micrometer-prometheus-api    | 2021-05-14 05:25:26.655  INFO 1 --- [nio-8080-exec-1] o.s.web.servlet.DispatcherServlet        : Initializing Servlet 'dispatcherServlet'
micrometer-prometheus-api    | 2021-05-14 05:25:26.657  INFO 1 --- [nio-8080-exec-1] o.s.web.servlet.DispatcherServlet        : Completed initialization in 2 ms
リクエストログをみてみると、10秒おきにエンドポイントが叩かれてるのがわかります。
2021-05-14 06:05:39.806 DEBUG 1 --- [nio-8080-exec-7] o.s.w.f.CommonsRequestLoggingFilter      : Before request [GET /actuator/prometheus]
2021-05-14 06:05:39.816 DEBUG 1 --- [nio-8080-exec-7] o.s.w.f.CommonsRequestLoggingFilter      : Request data : GET /actuator/prometheus]
2021-05-14 06:05:49.784 DEBUG 1 --- [nio-8080-exec-9] o.s.w.f.CommonsRequestLoggingFilter      : Before request [GET /actuator/prometheus]
2021-05-14 06:05:49.789 DEBUG 1 --- [nio-8080-exec-9] o.s.w.f.CommonsRequestLoggingFilter      : Request data : GET /actuator/prometheus]
2021-05-14 06:05:59.785 DEBUG 1 --- [nio-8080-exec-8] o.s.w.f.CommonsRequestLoggingFilter      : Before request [GET /actuator/prometheus]
2021-05-14 06:05:59.792 DEBUG 1 --- [nio-8080-exec-8] o.s.w.f.CommonsRequestLoggingFilter      : Request data : GET /actuator/prometheus]
2021-05-14 06:06:09.788 DEBUG 1 --- [io-8080-exec-10] o.s.w.f.CommonsRequestLoggingFilter      : Before request [GET /actuator/prometheus]
2021-05-14 06:06:09.796 DEBUG 1 --- [io-8080-exec-10] o.s.w.f.CommonsRequestLoggingFilter      : Request data : GET /actuator/prometheus]
PrometheusのUIを確認
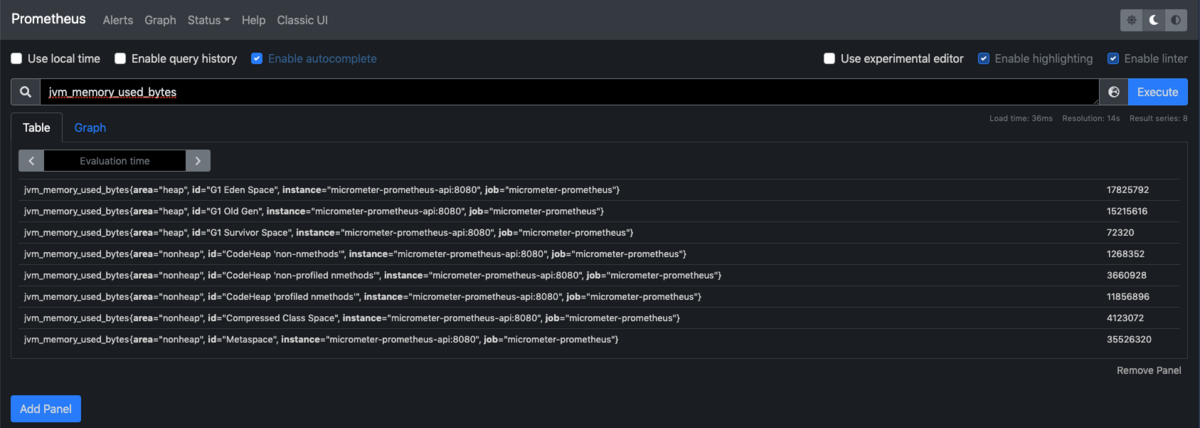
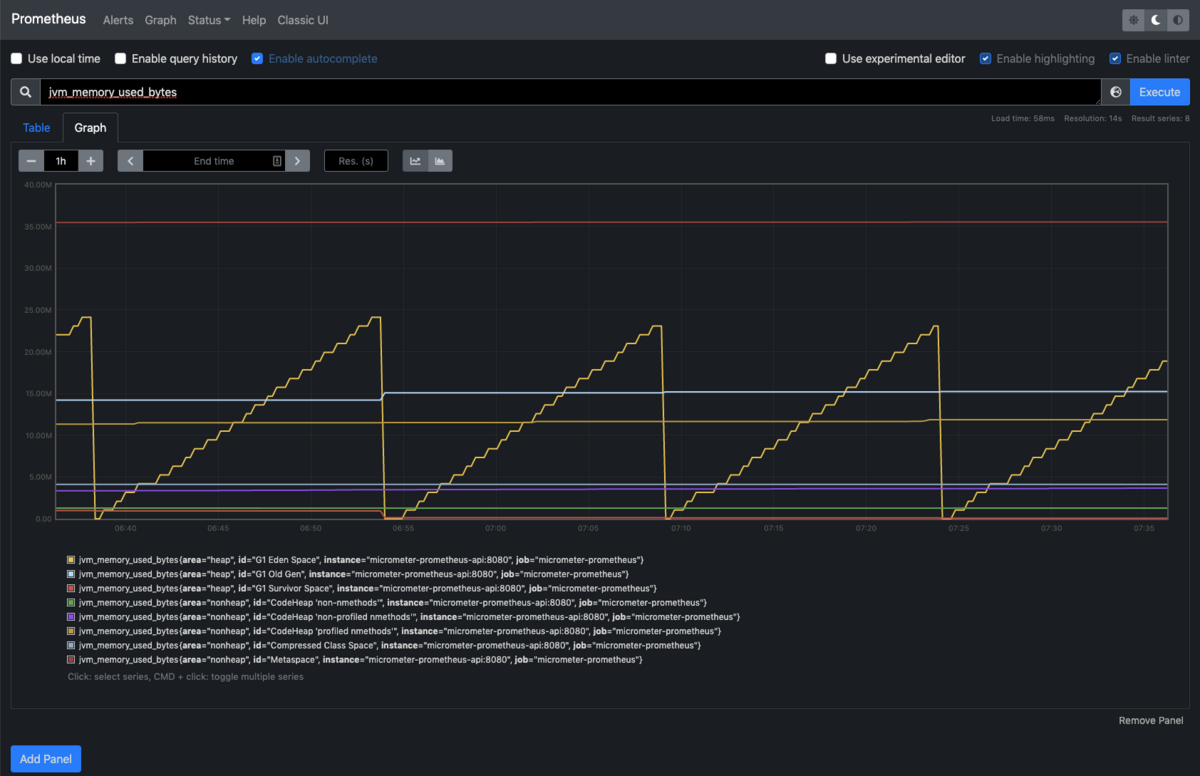
ブラウザで、Prometheusにアクセスすると、UIを見ることできます。 「Expression」にPromQLを入力して「Execute」ボタンを押下すると表示されます。
● Table
● Graph
やってみた記事なので、一旦ここまで。